


U.S. economy remained strong in Q3
Chief Economist Eugenio J. Alemán discusses current economic conditions.
From current data, it is clear there are no signs the U.S. economy is currently facing challenges. The retail and food services sales report on October 17 confirmed that barring any downward revision to September’s estimates, the U.S. consumer finished another strong quarter. But the headline numbers are probably not giving a completely correct picture of the health of the U.S. consumer. Clearly, higher-income consumer sectors continue to engage in the economy due to strong interest income earnings, strong stock market returns, and thus a very strong increase in financial and housing wealth.
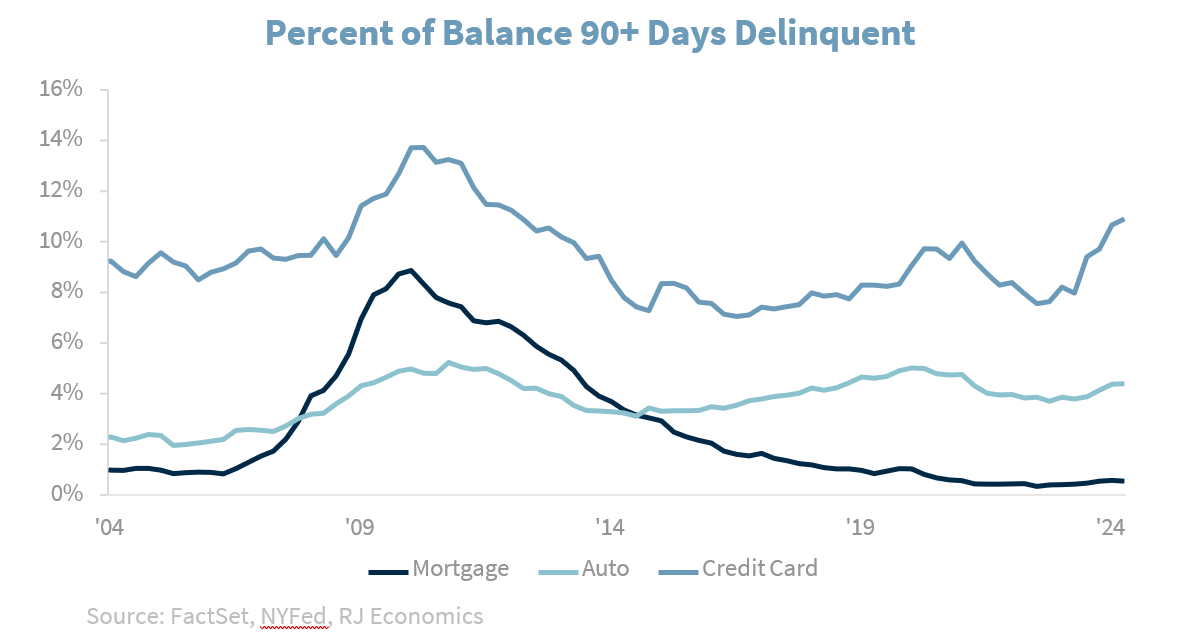
However, lower-income consumers are struggling, as shown by increased auto and consumer loan delinquencies. Business sector commentaries also show consumers penny-pinching and looking to save by changing brands and choosing more generic products. Yesterday’s retail and food services sales data also showed that the consumption of big-ticket items weakened considerably in September even though the overall retail report was relatively strong. These large discretionary purchases are typically the first indication of trouble in consumer land.
Hopefully, the Federal Reserve’s strong move in interest rates in September plus the 50 basis points of expected rate cuts – one 25 bp cut in November and another 25 bp cut in December – will bring down interest rates and allow some recovery in these discretionary sectors over the next several quarters. We are still expecting some weakening in economic growth over the next several quarters but continue to expect the economy to achieve a soft landing.
The myth of government employment
Sometimes we are accused of being lenient on the U.S. government in our presentations and speeches, but what we are is against misinformation. We could probably argue that the U.S. government is not good at administering taxpayers’ money. But that label has fit both parties equally over the decades. As trained economists, we live and die by the numbers, and many of the things we hear and read are so way off that we feel that sometimes we have to intervene to settle the score.
For the record, one of us worked as a federal government employee. So, if I do not rely on the data, many will probably assume that I am biased. And, I do have very fond memories of my work with some exceptional colleagues in the federal government as well as the many great colleagues I have worked alongside within the private sector, which is the sector I have worked for during 97% of my career as a professional economist.
Back to our topic. One of the myths we have to tackle over and over again has to do with the size of the US government, which typically means the federal government. One way to measure the size of the U.S. government is by looking at the number of workers. However, when we talk about the U.S. government, we are not only referring to the federal government as is typically the case, but also to state and local governments. And if you measure the size of the different levels of government by the number of workers each one has, it is easy to see that the federal government is a highly efficient machine, as well as a very small one, at least by this measure!
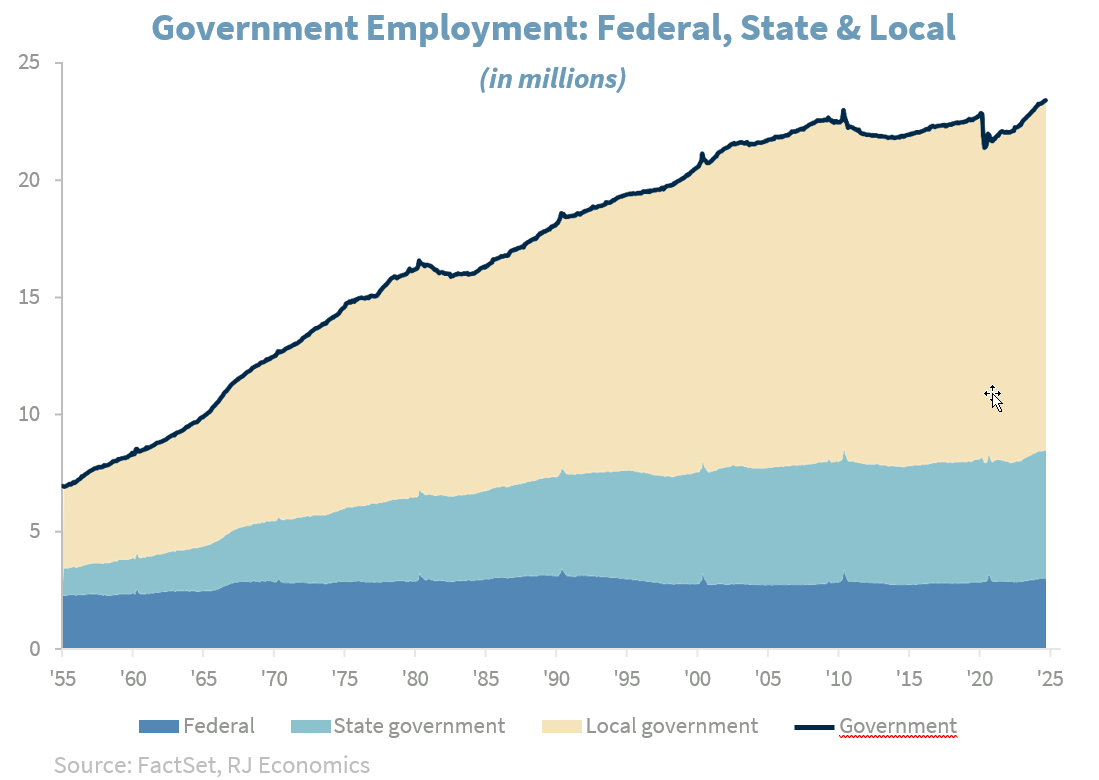
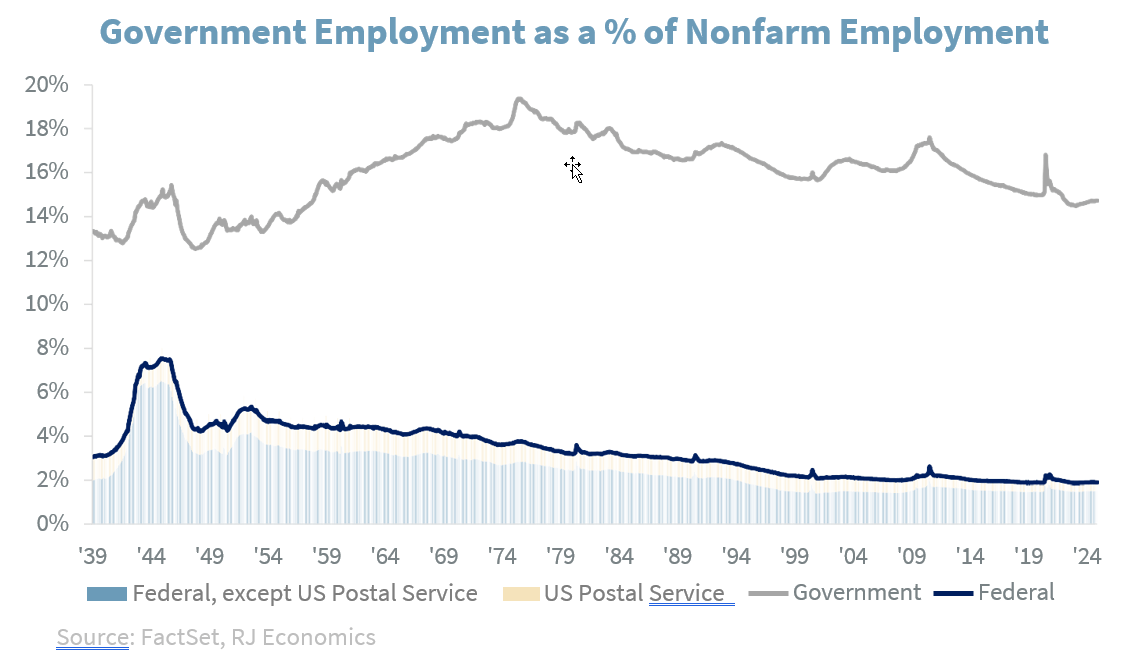
The number of federal government employees in September of 2024 was about 3.0 million out of total nonfarm employment of more than 159 million, or barely 1.88% of the total. If we take out U.S. Postal Service workers, the number declines to 2.4 million, which is about 1.5% of total nonfarm payrolls.1 Furthermore, federal government employees are about 12.8% of total government workers while the rest are state and local government workers. By the way, federal government workers as a percentage of total nonfarm payrolls was 3.05% in January of 1939! (See the graph below.)
So, 87.2% of total government employment occurs at the state and local government levels, not at the federal government level. Thus, whenever people use federal government workers as scapegoats to criticize the federal government, they should remember that for the size of our economy, the size of our federal government workforce is negligible.
Furthermore, according to the Congressional Budget Office (CBO), of all the money spent by the federal government in compensation in 2022, “About 60 percent of that total was spent on civilian personnel working in the Department of Defense, the Department of Foreign Affairs, and the Department of Homeland Security.”2 Thus, we can criticize the U.S. government for other reasons, but in terms of employment, federal government employment as a percentage of total employment has continued to decline. By the way, the spikes every ten years are due to temporary hiring for the U.S. Census.
Economic and market conditions are subject to change.
Opinions are those of Investment Strategy and not necessarily those of Raymond James and are subject to change without notice. The information has been obtained from sources considered to be reliable, but we do not guarantee that the foregoing material is accurate or complete. There is no assurance any of the trends mentioned will continue or forecasts will occur. Last performance may not be indicative of future results.
Consumer Price Index is a measure of inflation compiled by the US Bureau of Labor Statistics. Currencies investing is generally considered speculative because of the significant potential for investment loss. Their markets are likely to be volatile and there may be sharp price fluctuations even during periods when prices overall are rising.
Consumer Sentiment is a consumer confidence index published monthly by the University of Michigan. The index is normalized to have a value of 100 in the first quarter of 1966. Each month at least 500 telephone interviews are conducted of a contiguous United States sample.
Personal Consumption Expenditures Price Index (PCE): The PCE is a measure of the prices that people living in the United States, or those buying on their behalf, pay for goods and services. The change in the PCE price index is known for capturing inflation (or deflation) across a wide range of consumer expenses and reflecting changes in consumer behavior.
The Consumer Confidence Index (CCI) is a survey, administered by The Conference Board, that measures how optimistic or pessimistic consumers are regarding their expected financial situation. Current Situation Index (CSI) and Future Expectations Index (FEI) are the end-results of CCI, covering economic conditions, employment, price, income, and expense. The reading is 100 plus the average of said five factors
Certified Financial Planner Board of Standards Inc. owns the certification marks CFP®, CERTIFIED FINANCIAL PLANNER®, CFP® (with plaque design) and CFP® (with flame design) in the U.S., which it awards to individuals who successfully complete CFP Board's initial and ongoing certification requirements.
Links are being provided for information purposes only. Raymond James is not affiliated with and does not endorse, authorize or sponsor any of the listed websites or their respective sponsors. Raymond James is not responsible for the content of any website or the collection or use of information regarding any website's users and/or members.
GDP Price Index: A measure of inflation in the prices of goods and services produced in the United States. The gross domestic product price index includes the prices of U.S. goods and services exported to other countries. The prices that Americans pay for imports aren't part of this index.
The Conference Board Leading Economic Index: Intended to forecast future economic activity, it is calculated from the values of ten key variables.
The U.S. Dollar Index is an index of the value of the United States dollar relative to a basket of foreign currencies, often referred to as a basket of U.S. trade partners' currencies. The Index goes up when the U.S. dollar gains "strength" when compared to other currencies.
The FHFA House Price Index (FHFA HPI®) is a comprehensive collection of public, freely available house price indexes that measure changes in single-family home values based on data from all 50 states and over 400 American cities that extend back to the mid-1970s.
The Pending Home Sales Index (PHSI) tracks home sales in which a contract has been signed but the sale has not yet closed.
Supplier Deliveries Index: The suppliers' delivery times index from IHS Markit's PMI business surveys captures the extent of supply chain delays in an economy, which in turn acts as a useful barometer of capacity constraints.
Backlog of Orders Index: The Backlog of Orders Index represents the share of orders that businesses have received but have yet to start or finish. An increasing index value usually indicates growth in business but shows that output is below its maximum potential.
Import Price Index: The import price index measure price changes in goods or services purchased from abroad by
U.S. residents (imports) and sold to foreign buyers (exports). The indexes are updated once a month by the Bureau of Labor Statistics (BLS) International Price Program (IPP).
ISM Services PMI Index: The Institute of Supply Management (ISM) Non-Manufacturing Purchasing Managers' Index (PMI) (also known as the ISM Services PMI) report on Business, a composite index is calculated as an indicator of the overall economic condition for the non-manufacturing sector.
Consumer Price Index (CPI) A consumer price index is a price index, the price of a weighted average market basket of consumer goods and services purchased by households.
Producer Price Index: A producer price index (PPI) is a price index that measures the average changes in prices received by domestic producers for their output.
Industrial production: Industrial production is a measure of output of the industrial sector of the economy. The industrial sector includes manufacturing, mining, and utilities. Although these sectors contribute only a small portion of gross domestic product, they are highly sensitive to interest rates and consumer demand.
The NAHB/Wells Fargo Housing Opportunity Index (HOI) for a given area is defined as the share of homes sold in that area that would have been affordable to a family earning the local median income, based on standard mortgage underwriting criteria.
Conference Board Coincident Economic Index: The Composite Index of Coincident Indicators is an index published by the Conference Board that provides a broad-based measurement of current economic conditions, helping economists, investors, and public policymakers to determine which phase of the business cycle the economy is currently experiencing.
Conference Board Lagging Economic Index: The Composite Index of Lagging Indicators is an index published monthly by the Conference Board, used to confirm and assess the direction of the economy's movements over recent months.
New Export Index: The PMI new export orders index allows us to track international demand for a country's goods and services on a timely, monthly, basis.
Durable Goods: Durable goods orders reflect new orders placed with domestic manufacturers for delivery of long- lasting manufactured goods (durable goods) in the near term or future.
Source: FactSet, data as of 9/20/2024

Raymond James financial advisors may only conduct business with residents of the states and/or jurisdictions for which they are properly registered. Therefore, a response to a request for information may be delayed. Please note that not all of the investments and services mentioned are available in every state. Investors outside of the United States are subject to securities and tax regulations within their applicable jurisdictions that are not addressed on this site. Contact your local Raymond James office for information and availability.
Links are being provided for information purposes only. Raymond James is not affiliated with and does not endorse, authorize or sponsor any of the listed websites or their respective sponsors. Raymond James is not responsible for the content of any website or the collection or use of information regarding any website's users and/or members.
Investment advisory services offered through Raymond James Financial Services Advisors, Inc.. Towne Bank and Towne Wealth Management are not registered broker/dealers and are independent of Raymond James Financial Services. Investment products are: not deposits, not FDIC/NCUA insured, not insured by any government agency, not bank guaranteed, subject to risk and may lose value.
© 2024 Securities offered through Raymond James Financial Services, Inc., member FINRA / SIPC
| Legal Disclosures | Privacy, Security & Account Protection | Terms of Use
Investment and Insurance products are:
- NOT A DEPOSIT
- NOT FDIC-INSURED
- NOT GUARANTEED BY TOWNEBANK
- NOT INSURED BY ANY STATE OR FEDERAL GOVERNMENT AGENCY
- SUBJECT TO RISK AND MAY LOSE VALUE
